Data cleaning & analysis
For this assignment, I’ve chosen to work with a cleaned dataset that I used for my final project. The data comes from the city’s canopy change assessment, and includes temperature measurements for the morning, afternoon, and evening for each census tract on a particular day in July 2019. When I cleaned the data, I added a “neighborhood” column, associating each census tract with the Boston neighborhood it falls within.
The cleaned dataset.
The dataset also contains some geographical information that, for my purposes in this assignment, I’m going to ignore. I started out by creating a basic pivot table. After considering my options for values to chart, I realized that I could use the pivot table to calculate the average temperature of each neighborhood (thanks to the cleaning work I did prior to this assignment). I started with afternoon temperatures.
First pivot table.
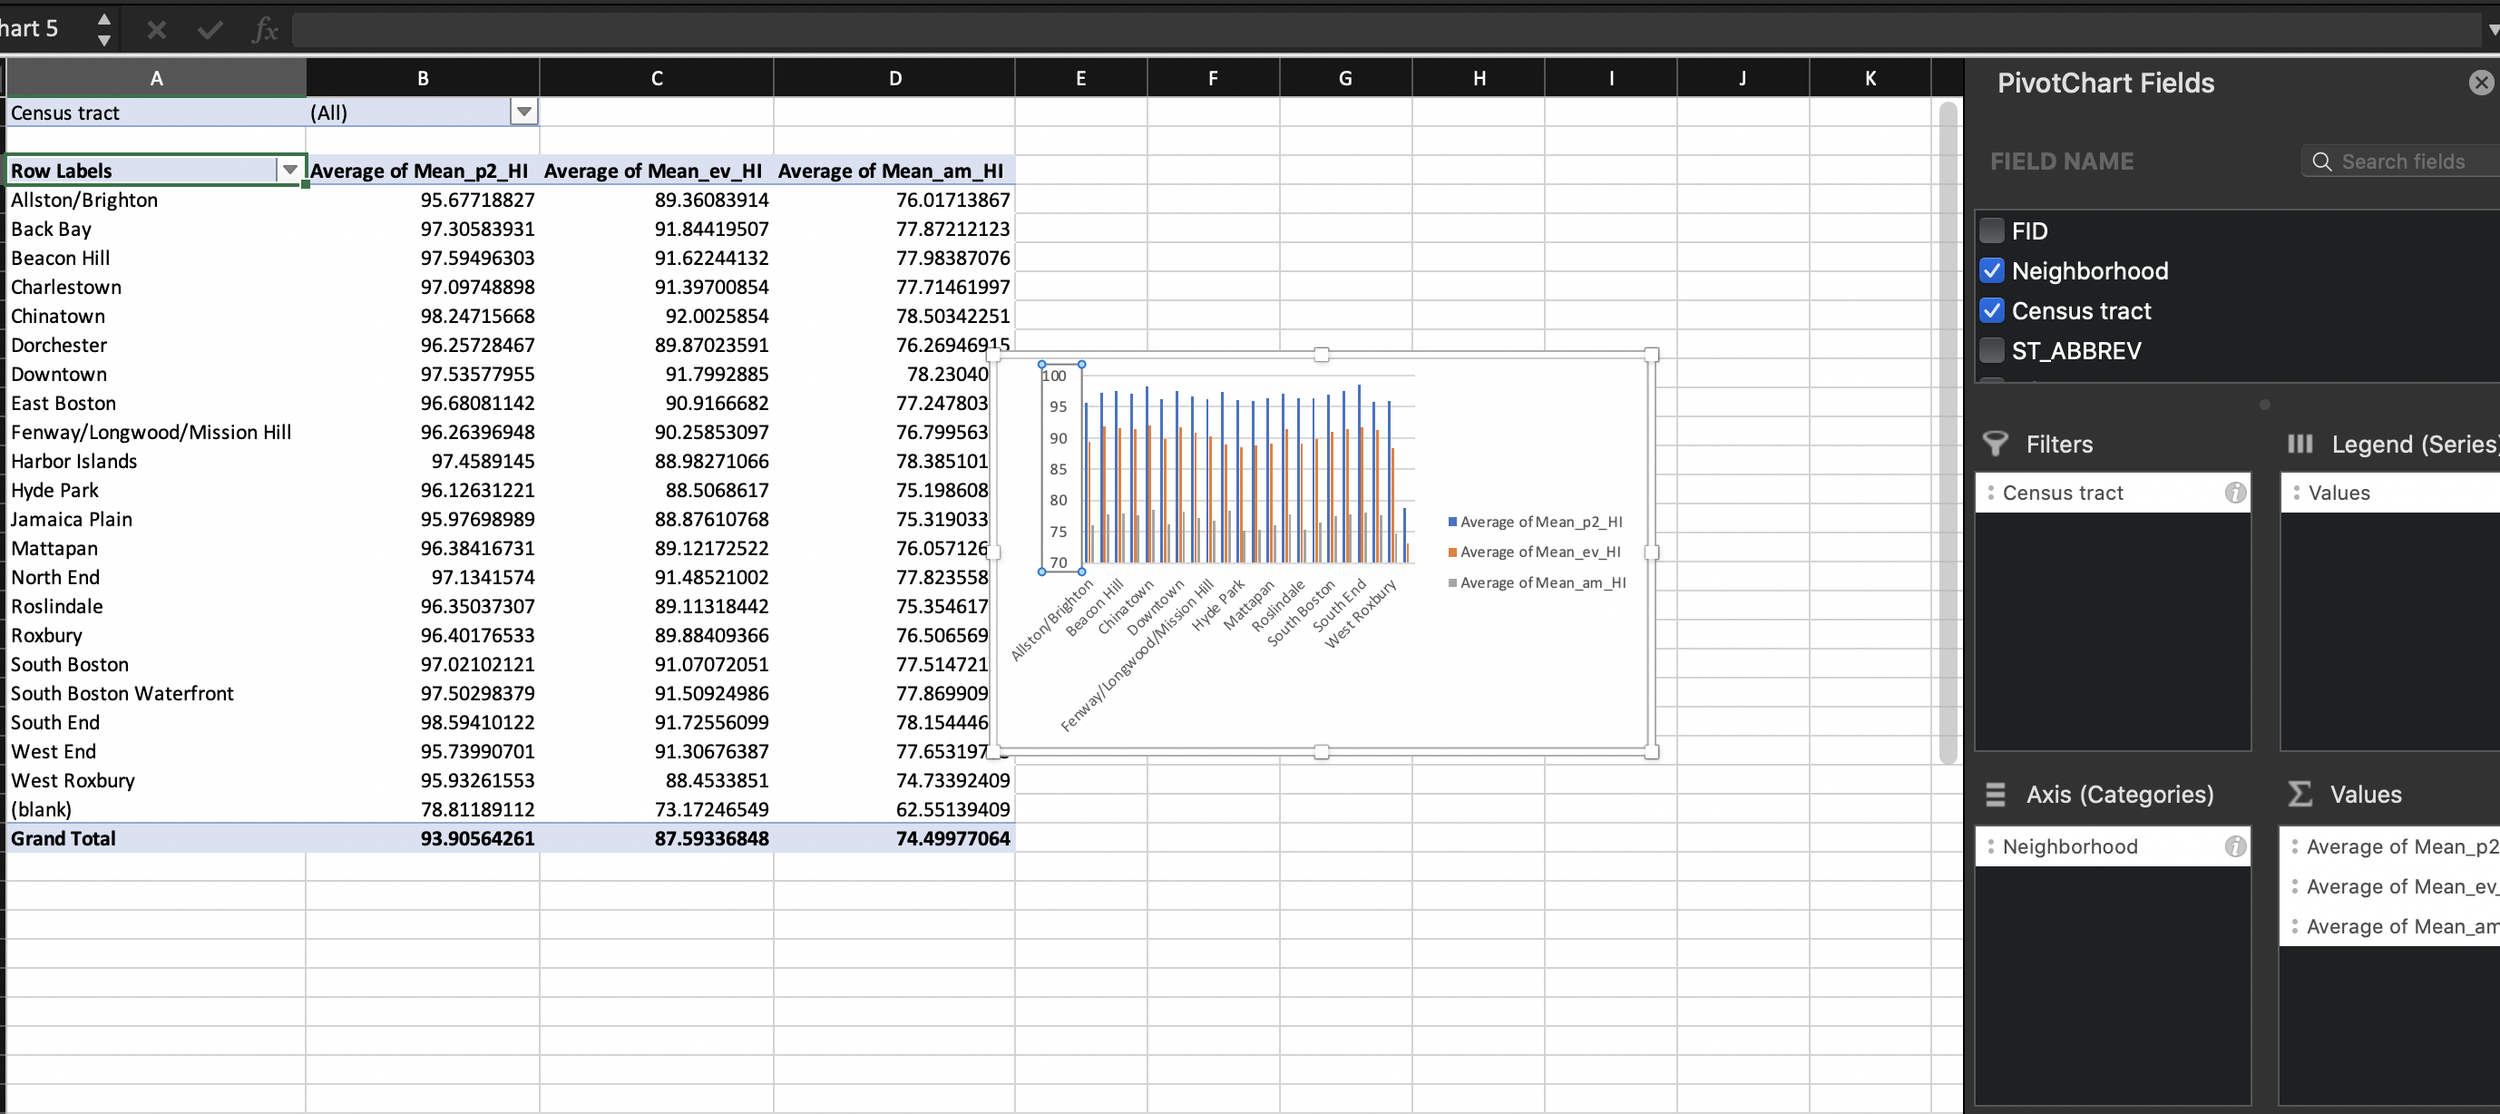
Notice the null values. That represents data from census tracts that didn’t fall within Boston’s city limits. I then added morning and evening temperature values, and was able to compare temperature averages by neighborhood, by time of day. That allowed me to see which neighborhoods, on average, got the hottest, and which neighborhoods stayed the hottest for the longest.
Expanded pivot table.
I didn’t really have a good option for a timeline, so I started playing around with slicers. At one point, I used a slicer to isolate each individual neighborhood.
Neighborhood slicer.
Eventually, I settled on using the pivot chart option. The resulting bar graph shows temperature data by neighborhood for the three times of day the data was collected.
Data with pivot table.
Resulting pivot chart.
The data story that makes the most sense to me based off of the work I’ve done here is something exploring temperature disparities in Boston neighborhoods (which so happens to be my final project). Though, if I were to switch up the angle, I’d use this data to look at neighborhoods that retain heat the longest. This could either be a good change or comparison story.


