Data User Guide: City of Boston municipal energy use
The City of Boston’s dataset tracking energy use at municipal buildings and properties.
Original purpose and application
The City of Boston has taken on lofty emission reduction goals as a part of its plan to combat climate change. Former Mayor Marty Walsh mandated in an executive order signed in 2011 that the city be carbon-neutral by 2050. A driving force behind harmful greenhouse gas emissions: energy consumption.
To better understand exactly how much energy the city is using on its properties and what impact, if any, new policies aimed at slashing emissions are making, this dataset was created. The data is collected, synthesized, and audited by the city’s Environment Department and used in presentations, visualizations, etc. to help inform energy policy. The data set tracks energy consumption of any kind — including electricity, gas, and water — and is collected from all city-owned properties, including government buildings, street lamps, and traffic lights.
History, standards, and format
The public monthly utility dataset was first launched in 2011, though the data was not seriously used in the context of the city’s climate goals until around 2014. The dataset, in some form, has existed internally for decades. The Environment Department launched the public endeavor in the interest of transparency. The project took on new meaning in 2014 when the city signed an “energy saving performance contract,” that binds it to lowering total energy consumption by switching out existing infrastructure with more technologically advanced substitutes. The data has been used as justification for the city’s ongoing effort to convert its street lamps to LED lights.
The structure of this particular dataset has remained the same since the outset, and is based loosely on the bills the city gets from energy companies and the Boston Water and Sewer Commission. All of the information the city receives via electronic bills ends up in the database.
Organizational context
Chris Kramer, the city’s energy manager, is the lead authority on this dataset. Below Chris are folks within his department, including account liaisons, etc., who actually handle and audit the data. They are also responsible for the city’s thousands of separate accounts with Eversource, National Grid, etc. These folks are on the “front lines” in terms of finding places where energy consumption can be cut. The active city mandates for emission reductions are strict, according to Kramer, and can be a challenge for the department to meet. Occasionally, the dataset is delayed updating as the employees responsible for okaying the updates are tied up with other tasks.
Workflow
At the beginning of each month, the city receives bills from Eversource, National Grid, and the BWSC to its 2,000 plus active accounts. Each account is tied to a specific property. Properties include public schools buildings, fire stations, municipal offices, etc. And each street light or traffic light control box has its own account as well. These bills are all registered to the same account-holder, and go to the same city inbox where a cleaning software picks the relevant data points from the bills and compiles them into the internal database. There are several visualizations the city uses to more accurately observe its energy uses that automatically update off of the internal database. That same software also feeds into the public-facing database, but the updated totals are not published until an audit of the charges are finished.
Since the city buys energy in such massive bulk, its purchases are tax-exempt. Occasionally, Eversource or National Grid will make a coding error that leads to the city being charged a price for a certain property that includes tax. Hence the audit, which is conducted by a team of Environment Department employees.
Eversource and National Grid conduct audits of the charges as well. The finalization process typically takes a few months, so there is some lag in how often the public dataset is updated. At the time this User Guide was created, the dataset was about three months off the current date. The dataset is also used in several Climate Ready Boston teams, who build energy consumption numbers into their emissions calculations.
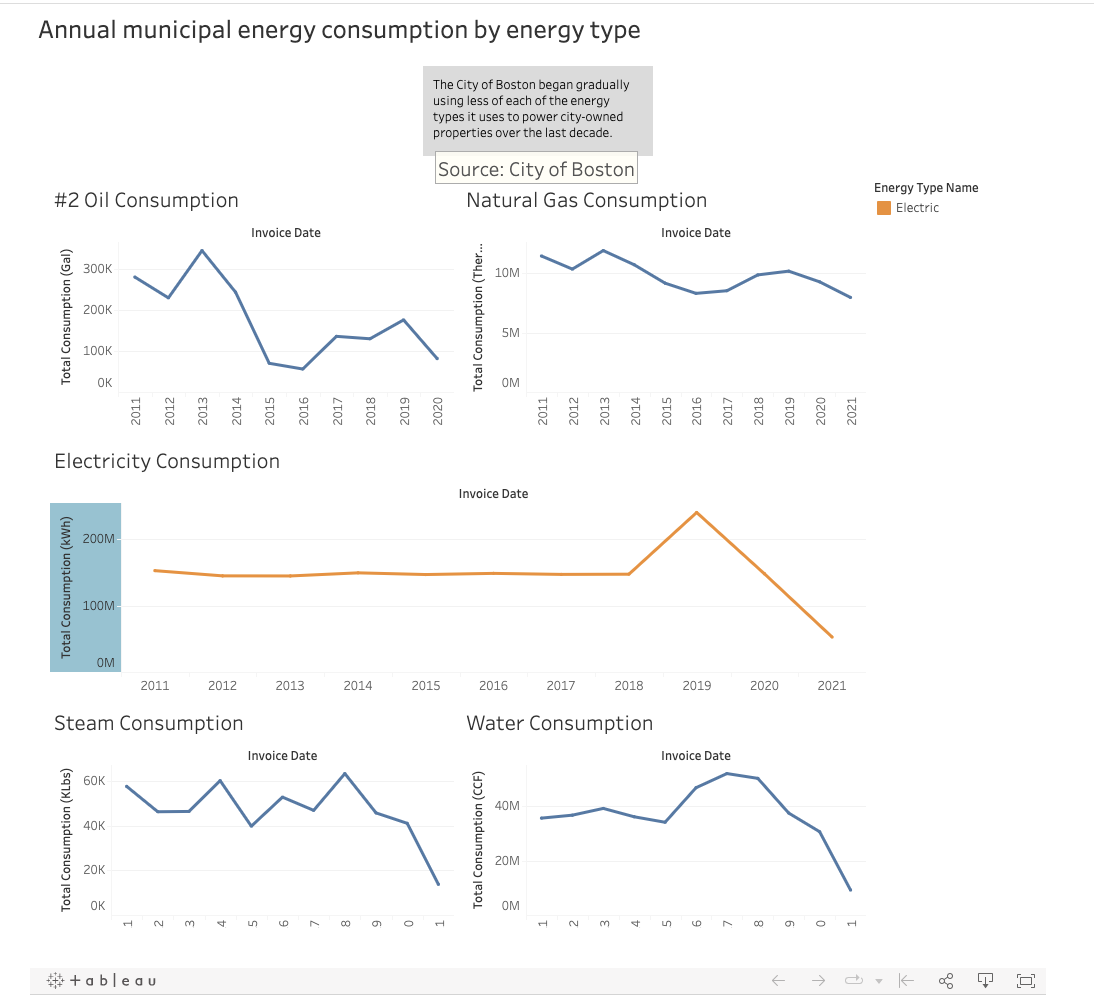
Exploratory Visualization/s of the Data
Source: City of Boston. Link. Link. Link. Link.
Things to know about the data, including limitations
The data doesn’t account for any alternative energy sources (solar power, wind power, etc.) In 2021 the city completed the first phase of its Renew Boston Trust initiative, which seeks to invest in energy efficiency and renewable energy measures for municipal buildings. The city is using some renewable energy sources, but that information is not compiled in the dataset because of the more complicated billing format, according to Kramer. Some renewable energy sources, like solar, require no bills. Since the dataset is built around bills from energy companies, there is currently no infrastructure in place to add renewable energy consumption to this dataset. That information would likely be filtered into an entirely new dataset, according to Kramer, as this dataset is used to identify potential areas to reduce emission-producing energy consumption.
There are also some minor errors in the data. For example, some neighborhoods are listed incorrectly. It is important to note that this dataset tracks energy consumption, not emissions.
Other Stories, Reports and Outputs from this data
A recent debate over gas-fueled street lamps has seen the data cited in news reports. And the city has cited the data in some of its key emissions-reduction ordinances.
Boston Globe: Boston plans to replace historic gas lamps with LEDs in effort to reduce carbon emissions
Boston.com: Beacon Hill goes green: Pilot program looks to swap gas lights for LEDs
City of Boston ordinance: Building energy reduction and disclosure
City of Boston: An order relative to municipal carbon-neutral buildings in Boston
Supplementary Information
Authors of this Data User Guide
Source Log
Chris Kramer (City of Boston)
617-635-2518
christopher.kramer@boston.gov
Bill Hinkle (Eversource)
william.hinkle@eversource.com
Mike Dalo (National Grid)
401-479-8523
Michael.Dalo@nationalgrid.com


